Michigan Redistricting Plan 2021
August 12, 2021 – U.S. Census Data is released
On September 30, 2021, the U.S. Census Data for 2020 is scheduled for release, and at this point, Michigan redistricting begins. The task must be completed quickly, as the 2022 Congressional elections are just one year away.
Theoretically, the following result is desired:
- Districts should be drawn to an equal population within 1-2 percent.
- Districts must be contiguous.
- Districts must be compact.
- Districts must comply with the 1965 Voting Rights Act and all Federal laws.
It is a complex task and an expensive one. The average state spends more than one million dollars to perform it, and the operation is directed primarily by politicians currently in office. The process has little transparency, and to the surprise of no one, districts are drawn to favor incumbents and the party in power.
Worse still, many states face extensive lawsuits due to gerrymandering, and the legal bills and re-redistricting costs will exceed the initial districting cost. This does not have to occur in Michigan.
Instead…
Imagine that Michigan’s census data is automatically run through optimization software, and each district is automatically drawn to the specifications above. The process is transparent, and the cost is approximately one-third of what states normally pay. Adjustments can be made after the fact, but any change of methodology would be documented and open to scrutiny.
Optimization Defined
Optimization, also called mathematical programming, is a mathematical methodology that achieves the best possible solution for a problem with multiple parameters. Optimization is widely used in corporations for planning and production, where it is utilized to maximize profit and minimize cost.
Political redistricting presents an ideal optimization problem, since multiple parameters must be simultaneously employed, the parameters are determined by the state, and the process is transparent with fair and objective results.
Optimization Test – Michigan
Redistricting is an expensive endeavor, and thus any method of drawing the districts must be thoroughly examined and tested. We chose Michigan as a test for the following reasons:
It is reasonably large. With a population of 10,077,331 it is the 10th largest U.S. state.
It is reasonably diverse. Michigan has an African American population of nearly 15%, fairly similar to that of the U.S. as a whole.
It has strong liberal and conservative factions. Michigan has significant urban and rural populations, which traditionally vote for the Democratic and Republican parties respectively.
It is serious about ending gerrymandering. Michigan has recently established an Independent Citizens Redistricting Commission to assure it’s Congressional, State Senate, and State House district lines are drawn fairly.
Today’s Michigan U.S. Congressional Districts
Before we begin optimizing Congressional Districts, it is useful to review current Michigan districts.
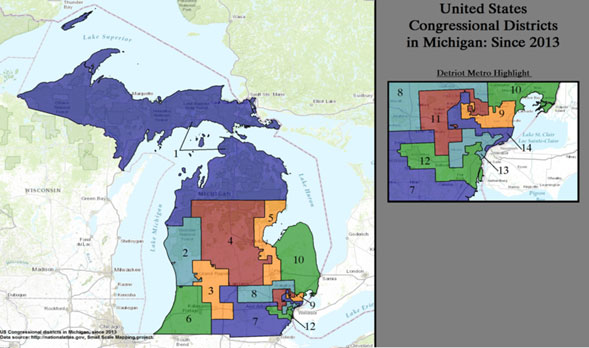
Current Michigan U.S. Congressional Districts
Figure 1 represents the most recent U.S. Congressional map of Michigan, which was drawn from 2010 Census data by the Republican-led Michigan legislature. Many considered the map an example of gerrymandering. As a result, in 2017 the Michigan Democrats and the League of Women Voters jointly filed a lawsuit stating that the districts were drawn by Republicans to disenfranchise Democrats. A panel of three Federal judges agreed, unanimously ruling that the map represented a political gerrymander “of historical proportions,” and that its’ primary purpose was indeed to “subordinate the interests of Democratic voters and entrench Republicans in power.”
The suit was appealed to the U.S. Supreme Court, where the decision of the lower court was overturned. In a 5-4 ruling, Chief Justice John Roberts agreed that though the districts were “highly partisan by any measure,” state redistricting is “beyond the reach of the federal courts,” and that states should handle districting issues themselves.
In a parallel action, in November 2018, Michigan voters voted to create an independent Citizens Redistricting Committee, to ensure that all redistricting is performed in a non-political manner.
Michigan Congressional Districts Optimized for Equal Population, Contiguity and Compactness
Because optimization is a complex program which examines millions of possible solutions, we have divided it into a two-step process. In the first step, we have optimized for equal population, contiguity and compactness using the 2010 population and tract data but divided it into the 13 districts needed for 2020, which represents the loss of one district from 2010.
Figure 2
Ethnic Breakdown of Michigan Districts Optimized for Equal Population, Contiguity and Compactness
| District | # | Population | Over/Under |
| MI26009960500 | 1 | 760278 | 9 |
| MI26117970500 | 2 | 760293 | 24 |
| MI26145011300 | 3 | 760282 | 13 |
| MI26081014602 | 4 | 760272 | 3 |
| MI26045020304 | 5 | 760285 | 16 |
| MI26093713100 | 6 | 760269 | 0 |
| MI26099223800 | 7 | 760291 | 22 |
| MI26077003003 | 8 | 760265 | 4 |
| MI26075006200 | 9 | 760271 | 2 |
| MI26163564504 | 10 | 760269 | 0 |
| MI26125171000 | 11 | 760285 | 16 |
| MI26163573702 | 12 | 760291 | 22 |
| MI26163550700 | 13 | 760289 | 20 |
| Average/Max | 760280 | 24 |
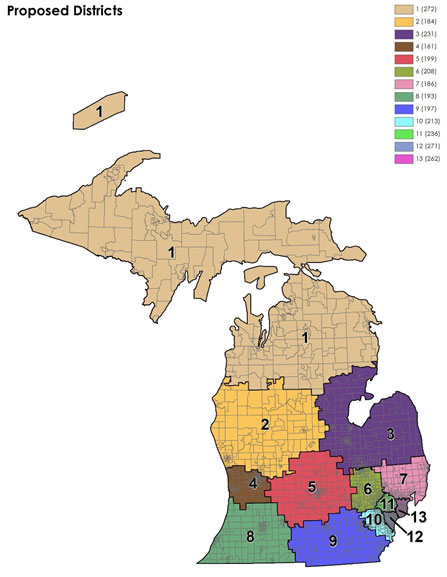
The map of the optimized is shown in Figure 3. The districts are clearly both contiguous and compact.
Figure 3
Proposed Michigan 2020 U.S. Congressional Districts Optimized for Equal Population, Contiguity and Compactness
Michigan Congressional Districts Optimized for Equal Population, Contiguity, and Majority Minority status
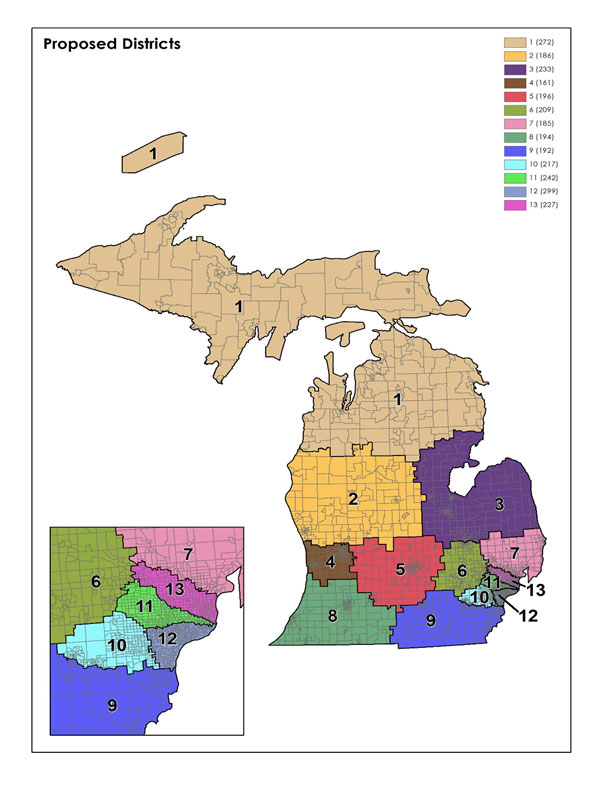
To fully comply with Federal law, the Voting Rights Act of 1965 mandates that majority-minority districts must be created whenever possible. In 2010, Michigan did not have concentrated Hispanic or Asian populations large enough to warrant a majority district. This was not true of the African American population, however, so in Step 2 a fourth parameter was added to determine if and where black majority districts could be formed.
This optimization produced two such districts. Figure 4 illustrates African American population percentage of the optimized thirteen districts. In the final redistricting, seen in Figure 5, Districts11 and 12 are now true majority minority districts. The population differential increased to 623, which is still a miniscule .082 percent variance.
Ethnic Breakdown of Michigan Districts Optimized for Equal Population, Contiguity and Compactness and Maximization of Majority-Minority Districts
| District | # | Population | Over/Under | Black Population | % |
| MI26009960500 | 1 | 760545 | 265 | 12205 | 2% |
| MI26117970500 | 2 | 760286 | 6 | 40647 | 5% |
| MI26145011300 | 3 | 760270 | 10 | 96437 | 13% |
| MI26081014602 | 4 | 760844 | 564 | 72599 | 10% |
| MI26045020304 | 5 | 760073 | 207 | 65429 | 9% |
| MI26093713100 | 6 | 760252 | 28 | 55308 | 7% |
| MI26099223800 | 7 | 760249 | 31 | 38800 | 5% |
| MI26077003003 | 8 | 760903 | 623 | 77415 | 10% |
| MI26115832800 | 9 | 760047 | 233 | 54965 | 7% |
| MI26163564504 | 10 | 759910 | 370 | 117623 | 15% |
| MI26125171000 | 11 | 760135 | 145 | 380087 | 50% |
| MI26163525700 | 12 | 759849 | 431 | 380161 | 50% |
| MI26099232400 | 13 | 760277 | 3 | 113838 | 15% |
| Average/Max | 760280 | 623 | 115809 | 15% |
Proposed Michigan 2020 U.S. Congressional Districts Optimized for Equal Population, Contiguity, Compactness and Maximization of Minority-Majority Districts
We would be remiss in not mentioning that maximizing the number of Majority-Minority districts probably reduces minority political power in Michigan. The Voting Rights Act of 1965 was initially written to increase the number of minority office holders, not to increase the clout of minority voters. Although Districts 11 and 12 are now majority-minority areas, it comes at the price of reducing African American population in District 13 from 39 percent to 15percent. If left as is, Districts 11, 12 and 13 would all likely vote for liberal candidates. Now, District 13 may not. “Packing” minority populations into single districts is a traditional method of reducing minority power. However, it is the law of the land, and until and unless that is changed, we must live by its’ provisions.
Moving Forward, 2021
We believe that computer optimization is the most transparent and fair method of creating political districts. That said, optimization is a highly challenging process that seeks the ideal answer to a problem with hundreds of millions of possible solutions. The enormity of the problem can be addressed in 2021 because states like Michigan are now seriously addressing the gerrymandering issue, while advances in computer software and hardware have made complex optimization possible. Furthermore, we believe that the combination of Encore Data, Inc. and Optimization Direct referred to in this document as “the Optimizers,” is uniquely fitted for this enterprise. Their recently developed optimization tool was specifically developed to handle models of this size.
Optimizer Biographies:
Ann Stephens
Encore Data, Inc.
Reston, Virginia
Ann Stephens began her career as Research Director of the Software Publishers Association, where she applied analytic techniques to determine future trends in the industry. From there, she founded PC Data in 1991, which tracked sales on a weekly basis of all PC hardware and software in the United States. In 1999, PC Data also began tracking Internet use in the U.S., Canada, Italy, Australia and China. The company was sold in 2001. Stephens is now CEO of Encore Data, a data consulting firm.
Over the past 30 years, she has provided data services to more than 200 technology companies, including Microsoft, Apple, Google, Symantec, IBM, Adobe Systems and Disney.
Stephens received an MBA from the University of Virginia in 1982. Her thesis, entitled “The Oakland A’s” provided a multiple regression program to optimize revenue, promotions and salaries for the Oakland A’s baseball team, and was the precursor to “Moneyball.”
Robert Ashford
President, Optimization Direct Inc.
Harrington Park, NJ
Robert Ashford is one of the world’s foremost authorities on optimization. He received a Master’s degree in Mathematics from Cambridge University and a Ph.D. from Warwick Business School and has authored more than 20 academic papers in Optimization. Robert co-founded Dash Optimization in 1984, where he pioneered the development of new modeling and solution technologies, driving the size, complexity and scope of optimizing programs. Dash Optimization was sold to FICO in 2008 and Ashford subsequently, co-founded Optimization Direct in 2014, which is an IBM partner. He is the original author of Xpress-MP, one of the world’s leading optimization systems.
Alkis Vazacopoulos
Optimization Direct, Inc.
Harrington Park, NJ
Alkis Vazacopoulos is a pioneer in using Parallel Programming for solving Large-Scale Optimization problems for vertical markets, particularly in Banking and Retail Industries. From January 2008 to January 2011 he was Vice President at FICO Research. Prior to that he was President of Dash Optimization, Inc. where he worked closely with end users, consulting companies, OEMs/ISVs in developing optimization solutions.
Vazacopoulos co-founded Optimization Direct in 2014. He also consults with Fortune 500 companies in the areas of finance, marketing optimization, data mining, supply chain, retail optimization, procurement and decision analytics.
The Proposal:
Encore Data Inc. and Optimization Direct Inc. (known from here on as “The Optimizers” will provide optimized redistricting for each of Michigan’s 13 US Congressional Districts, 38 State Senate Districts, and 110 State House Districts. The process will be transparent and the Commission will receive regular updates and preliminary results for review. The Commission will be able to correct or refine their parameters throughout the process if they require it. Upon completion, the Optimizers will provide a complete written description of the redistricting process and will submit detailed results of all districts. We expect the product will be delivered within 60 days after a contract is signed and/or data is received. The total price of redistricting Michigan through optimization is $278,500.
Our process is complex and thorough and the summary we present here cannot do it complete justice. Therefore, we would love to meet either remotely or in-person to present you with complete details and answer your questions. We will show you how optimization can turn redistricting from a political tool to a non-partisan science. Please contact us by email at: astephens@encore-data.com or by phone at 703-471-2189.
To demonstrate why optimization is needed, we have attached our paper, Ending Political Gerrymandering. It demonstrates the extent to which political gerrymandering has overrun the country. More importantly, it illustrates how a mathematical optimization would have scientifically redrawn the state of Virginia’s 2010 Congressional Districts by applying our optimization methodology.